“Indian Telecom Services Performance Indicator Report” for the Quarter April-June, 2024
Posted On: 09 OCT 2024 5:36PM by PIB Delhi
TRAI today has released the “Indian Telecom Services Performance Indicator Report” for the Quarter ending 30th June, 2024. This Report provides a broad perspective of the Telecom Services in India and presents the key parameters and growth trends of the Telecom Services as well as Cable TV, DTH & Radio Broadcasting services in India for the period covering 1st April, 2024 to 30th June, 2024 compiled mainly on the basis of information furnished by the Service Providers.
Executive Summary of the Report is enclosed. The complete Report is available on TRAI’s website (www.trai.gov.in and under the link http://www. trai.gov.in/release-publication/reports/performance-indicators-reports). Any suggestion or any clarification pertaining to this report, Shri Amit Sharma, Advisor (F&EA), TRAI may be contacted on Tel. +91-20907772 and e-mail: advfea2@trai.gov.in.
*****
SB/DP/ARJ
The Indian Telecom Services Performance Indicators
April–June, 2024
Executive Summary
- Total number of Internet subscribers increased from 954.40 million at the end of Mar-24 to 969.60 million at the end of Jun-24, registering a quarterly rate of growth 1.59%. Out of 969.60 million internet subscribers, number of Wired Internet subscribers are 42.04 million and number of Wireless Internet subscribers are 927.56 million.
Composition of internet subscription
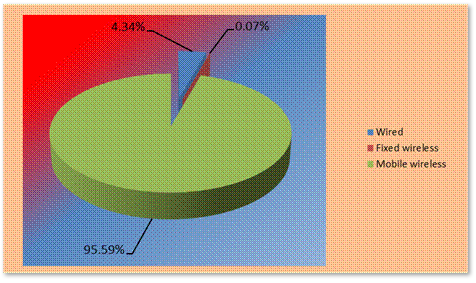
- The Internet subscriber base is comprised of Broadband Internet subscriber base of 940.75 million and Narrowband Internet subscriber base of 28.85 million.
- The broadband Internet subscriber base increased by 1.81% from 924.07 million at the end of Mar-24 to 940.75 million at the end of Jun-24. The narrowband Internet subscriber base decreased from 30.34 million at the end of Mar-24 to 28.85 million at the end of Jun-24.
- Wireline subscribers increased from 33.79 million at the end of Mar-24 to 35.11 million at the end of Jun-24 with a quarterly rate of growth 3.90% and, on Y-O-Y basis, wireline subscriptions also increased by 15.81% at the end of QE Jun-24.
- Wireline Tele-density increased from 2.41% at the end of Mar-24 to 2.50% at the end of Jun-24 with quarterly rate of growth 3.67%.
- Monthly Average Revenue per User (ARPU) for wireless service increased by 2.55%, from Rs.153.54 in QE Mar-24 to Rs.157.45 in QE Jun-24. On Y-O-Y basis, monthly ARPU for wireless service increased by 8.11% in this quarter.
- Prepaid ARPU per month increased from Rs.150.74 in QE Mar-24 to Rs.154.80 in QE Jun-24 and Postpaid ARPU per month also increased from Rs.187.85 in QE Mar-24 to Rs.189.17 in QE Jun-24.
- On an all-India average, the overall MOU per subscriber per month decreased by 2.16% from 995 in Q.E. Mar-2024 to 974 in Q.E. Jun-2024.
- Prepaid MOU per subscriber is 1010 and Postpaid MOU per subscriber per month is 539 in QE Jun-24.
- Gross Revenue (GR), Applicable Gross Revenue (ApGR) and Adjusted Gross Revenue (AGR) of Telecom Service Sector for the Q.E. Jun-24 has been Rs.86,031 Crore, Rs.83,087 crore and Rs.70,555 Crore respectively. GR decreased by 2.16%, ApGR decreased by 1.02% and AGR increased by 0.13% in Q.E. Jun-24, as compared to previous quarter.
- The Y-O-Y rate of growth in GR, ApGR and AGR in Q.E. Jun-24 over the same quarter in last year has been 6.34%, 6.05% and 7.51% respectively.
- Pass Through Charges decreased from Rs.13,482 Crore in QE Mar-24 to Rs.12,561 Crore in QE Jun-24 with quarterly rate of decline 6.84%. The Y-O-Y rate of decline 4.99% has been recorded in pass-through charges for QE Jun-24.
- The License Fee increased from Rs.5,637 Crore for the QE Mar-24 to Rs.5,645 Crore for the QE Jun-24. The quarterly and the Y-O-Y rates of growth in license fees are 0.14% and 7.62% respectively in this quarter.
Service-wise composition of Adjusted Gross Revenue
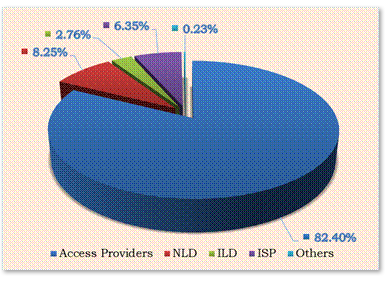
- Access services contributed 82.40% of the total Adjusted Gross Revenue of telecom services. In Access services, Gross Revenue (GR), Applicable Gross Revenue (ApGR), Adjusted Gross Revenue (AGR), License Fee, Spectrum Usage Charges (SUC) and Pass Through Charges increased by -0.69%, 1.32%, 2.83%, 2.81%, 0.35% and -6.93% respectively in QE Jun-24.
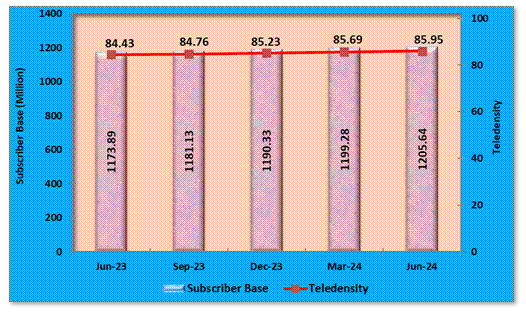
- The number of telephone subscribers in India increased from 1,199.28 million at the end of Mar-24 to 1,205.64 million at the end of Jun-24, registering a rate of growth 0.53% over the previous quarter. This reflects Year-On-Year (Y-O-Y) rate of growth 2.70% over the same quarter of the last year. The overall Tele-density in India increased from 85.69% as in QE Mar-24 to 85.95% as in QE Jun-24.
Trends in Telephone subscribers and Tele-density in India
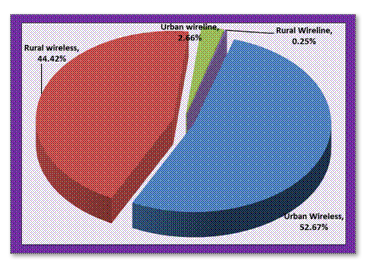
- Telephone subscribers in Urban areas increased from 665.38 million at the end of Mar-24 to 667.13 million at the end of Jun-24 however Urban Tele-density decreased from 133.72% to 133.46% during the same period.
- Rural telephone subscribers increased from 533.90 million at the end of Mar-24 to 538.51 million at the end of Jun-24 and Rural Tele-density also increased from 59.19% to 59.65% during the same period.
- Out of the total subscription, the share of Rural subscription increased from 44.52% at the end of Mar-24 to 44.67% at the end of Jun-24.
Composition of Telephone Subscribers
- With a net increase of 5.04 million subscribers during the quarter, the total wireless subscriber base increased from 1,165.49 million at the end of Mar-24 to 1,170.53 million at the end of Jun-24, registering a rate of growth 0.43% over the previous quarter. On Y-O-Y basis, wireless subscriptions also increased at the rate of 2.36% during the year.
- Wireless Tele-density increased from 83.27% at the end of Mar-24 to 83.45% at the end of Jun-24 with quarterly rate of growth 0.21%.
- During this quarter, the following parameters in terms of QoS benchmarks have been fully complied by wireline service providers: –
-
- Fault incidences (No. of faults per 100 subs/month) (≤ 7)
- % Fault repaired by next working day (for rural and hilly areas) (≥ 75%)
- % Fault repaired within 7 days (for rural and hilly areas) (100%)
- Point of Interconnection (POI) Congestion (No. of PoIs not meeting benchmark) (≤ 0.5%)
- Metering and billing credibility- post-paid (≤ 0.1%)
- Metering and billing credibility- pre-paid (≤ 0.1%)
- Resolution of billing/charging/credit & validity complaints within 4 weeks (98% within 4 weeks)
- Resolution of billing/charging/credit & validity complaints within 6 weeks (100% within 6 weeks)
- Period of applying credit/waiver/adjustment to customer’s account from the date of resolution of complaints (100% within 1 week of resolution of complaint)
- Accessibility of call centre/ customer care (≥ 95%)
- The following parameters have shown improvement, as compared to the previous quarter, in QoS by wireline service providers: –
-
- Accessibility of call centre/ customer care ≥ 95%
- %age of calls answered by the operators (voice to voice) within ninety seconds ≥ 95%
- During this quarter, list of Parameters which are fully complied, as compared to the previous quarter, by all the Cellular Mobile service providers: –
- Call Set-up Success Rate and Session Establishment Success Rate for Circuit Switched Voice or VoLTE as applicable (within licensee’s own network) ≥ 95%
- Network QoS DCR Spatial Distribution Measure [Network_ QSD (90,90)] ≤ 2%
- Network QoS DCR Temporal Distribution Measure [Network_ QTD (97,90)] ≤ 3%
- Connections with good voice quality, Circuit Switched Voice Quality and VoLTE quality ≥ 95%
- Down Link (DL) Packet Drop Rate or DL-PDR ≤ 2%
- Up Link (UL) Packet Drop Rate or UL-PDR ≤ 2%
- Point of Interconnection (POI) Congestion (No. of POIs not meeting the benchmark) ≤ 0.5%
- Metering and billing credibility – postpaid ≤ 0.1%
- Metering and billing credibility – prepaid ≤ 0.1%
- Resolution of billing/charging/validity complaints – 98% within 4 weeks
- Resolution of billing/charging/validity complaints – 100% within 6 weeks
- Accessibility of call centre/ customer care ≥ 95%
- Termination / Closure of service < 7 days
- Time taken for refund of deposits after closures (100% within 60 days)
- The following parameters have shown deterioration, as compared to the previous quarter, in QoS by Cellular Mobile service providers: –
-
- BS Accumulated downtime (not available for service) (%age) <=2%
- Worst affected BSs due to downtime (%age) <=2%
- SDCCH/ Paging Channel Congestion/ RRC Congestion (%age) <=1%
- TCH, RAB and E-RAB Congestion (%age) <=2%
- Period of applying credit/ waiver/ adjustment to customer’s account from the date of resolution of complaints – 100% within 1 week of resolution of complaint
- Percentage of calls answered by the operators (voice to voice) within ninety seconds ≥ 95%
- A total of approximately 912 private satellite TV channels have been permitted by the Ministry of Information and Broadcasting (MIB) for uplinking only/downlinking only/both uplinking & downlinking.
- As per the reporting done by broadcasters in pursuance of the Tariff Order dated 3rd March 2017, as amended, out of 902 permitted satellite TV channels which are available for downlinking in India, there are 362 satellite pay TV channels as on 30th June, 2024. Out of 362 pay channels, 259 are SD satellite pay TV channels and 103 are HD satellite pay TV channels.
- During the QE 30th June 2024, there were 4 pay DTH service providers in the country.
- Pay DTH has attained total active subscriber base of around 62.17 million. This is in addition to the subscribers of the DD Free Dish (free DTH services of Doordarshan). The total active subscriber base has increased from 61.97 million in March 2024 to 62.17 million in June 2024.
- Apart from the radio channels operated by All India Radio – the public broadcaster, as per the data reported by FM Radio operators to TRAI, as on 30th June 2024, there are 388 operational private FM Radio channels in 113 cities operated by 36 private FM Radio operators. As compared to the previous quarter, there is no change in the number of operational private FM Radio channels, cities and FM Radio operators.
- The advertisement revenue reported by FM Radio operators during the quarter ending 30th June 2024 in respect of 388 private FM Radio channels is Rs.428.45 crore as against Rs.491.98 crore in respect of 388 private FM Radio channels for the previous quarter.
- As on 30th June, 2024, 499 Community Radio stations are operational.
SNAPSHOT
|
(Data as on Q.E. 30th June, 2024) |
|
|
Telecom Subscribers (Wireless+Wireline) |
|
|
Total Subscribers |
1,205.64 Million |
|
% change over the previous quarter |
0.53% |
|
Urban Subscribers |
667.13 Million |
|
Rural Subscribers |
538.51 Million |
|
Market share of Private Operators |
91.97% |
|
Market share of PSU Operators |
8.03% |
|
Tele-density |
85.95% |
|
Urban Tele-density |
133.46% |
|
Rural Tele-density |
59.65% |
|
Wireless Subscribers |
|
|
Total Wireless Subscribers |
1,170.53 Million |
|
% change over the previous quarter |
0.43% |
|
Urban Subscribers |
635 Million |
|
Rural Subscribers |
535.53 Million |
|
Market share of Private Operators |
92.51% |
|
Market share of PSU Operators |
7.49% |
|
Tele-density |
83.45% |
|
Urban Tele-density |
127.03% |
|
Rural Tele-density |
59.32% |
|
Total Wireless Data Usage during the quarter |
56,183 PB |
|
Number of Public Mobile Radio Trunk Services (PMRTS) |
65,223 |
|
Number of Very Small Aperture Terminals (VSAT) |
2,51,840 |
|
Wireline Subscribers |
|
|
Total Wireline Subscribers |
35.11 Million |
|
% change over the previous quarter |
3.90% |
|
Urban Subscribers |
32.13 Million |
|
Rural Subscribers |
2.98 Million |
|
Market share of PSU Operators |
26.08% |
|
Market share of Private Operators |
73.92% |
|
Tele-density |
2.50% |
|
Rural Tele-density |
0.33% |
|
Urban Tele-density |
6.43% |
|
No. of Village Public Telephones (VPT) |
68,606 |
|
No. of Public Call Office (PCO) |
16,958 |
|
Telecom Financial Data |
|
|
Gross Revenue (GR) during the quarter |
Rs. 86,031/- crore |
|
% change in GR over the previous quarter |
-2.16% |
|
Applicable Gross Revenue (ApGR) during quarter |
Rs. 83,087/- crore |
|
% change in ApGR over the previous quarter |
-1.02% |
|
Adjusted Gross Revenue (AGR) during the quarter |
Rs.70,555/- crore |
|
% change in AGR over the previous quarter |
0.13% |
|
Share of Public sector undertakings in Access AGR |
3.53% |
|
Internet/Broadband Subscribers |
|
|
Total Internet Subscribers |
969.60 Million |
|
% change over previous quarter |
1.59% |
|
Narrowband subscribers |
28.85 Million |
|
Broadband subscribers |
940.75 Million |
|
Wired Internet Subscribers |
42.04 Million |
|
Wireless Internet Subscribers |
927.56 Million |
|
Urban Internet Subscribers |
562.27 Million |
|
Rural Internet Subscribers |
407.33 Million M |
|
Total Internet Subscribers per 100 population |
69.12 |
|
Urban Internet Subscribers per 100 population |
112.48 |
|
Rural Internet Subscribers per 100 population |
45.12 |
|
Total Outgoing Minutes of Usage for Internet Telephony |
87.01 Million |
|
No. of Public Wi-Fi Hotspots |
1,64,909 |
|
Aggregate Data Consumed (TB) for Public Wi-Fi Hotspots during the quarter |
13,094 |
|
Broadcasting & Cable Services |
|
|
Number of private satellite TV channels permitted by the Ministry of I&B for uplinking only/downlinking only/both uplinking and downlinking |
902 |
|
Number of Pay TV Channels as reported by broadcasters |
362 |
|
Number of private FM Radio Stations (excluding All India Radio) |
388 |
|
Number of total active subscribers with pay DTH operators |
62.17 Million |
|
Number of Operational Community Radio Stations |
499 |
|
Number of pay DTH Operators |
4 |
|
Revenue & Usage Parameters |
|
|
Monthly ARPU of Wireless Service |
Rs.157.45 |
|
Minutes of Usage (MOU) per subscriber per month – Wireless Service |
974 |
|
Wireless Data Usage |
|
|
Average Wireless Data Usage per wireless data subscriber per month |
21.30 GB |
|
Average revenue realization per GB for wireless data usage during the quarter |
Rs.8.31 |
(Release ID: 2063567)


: Detection and Prevention")


