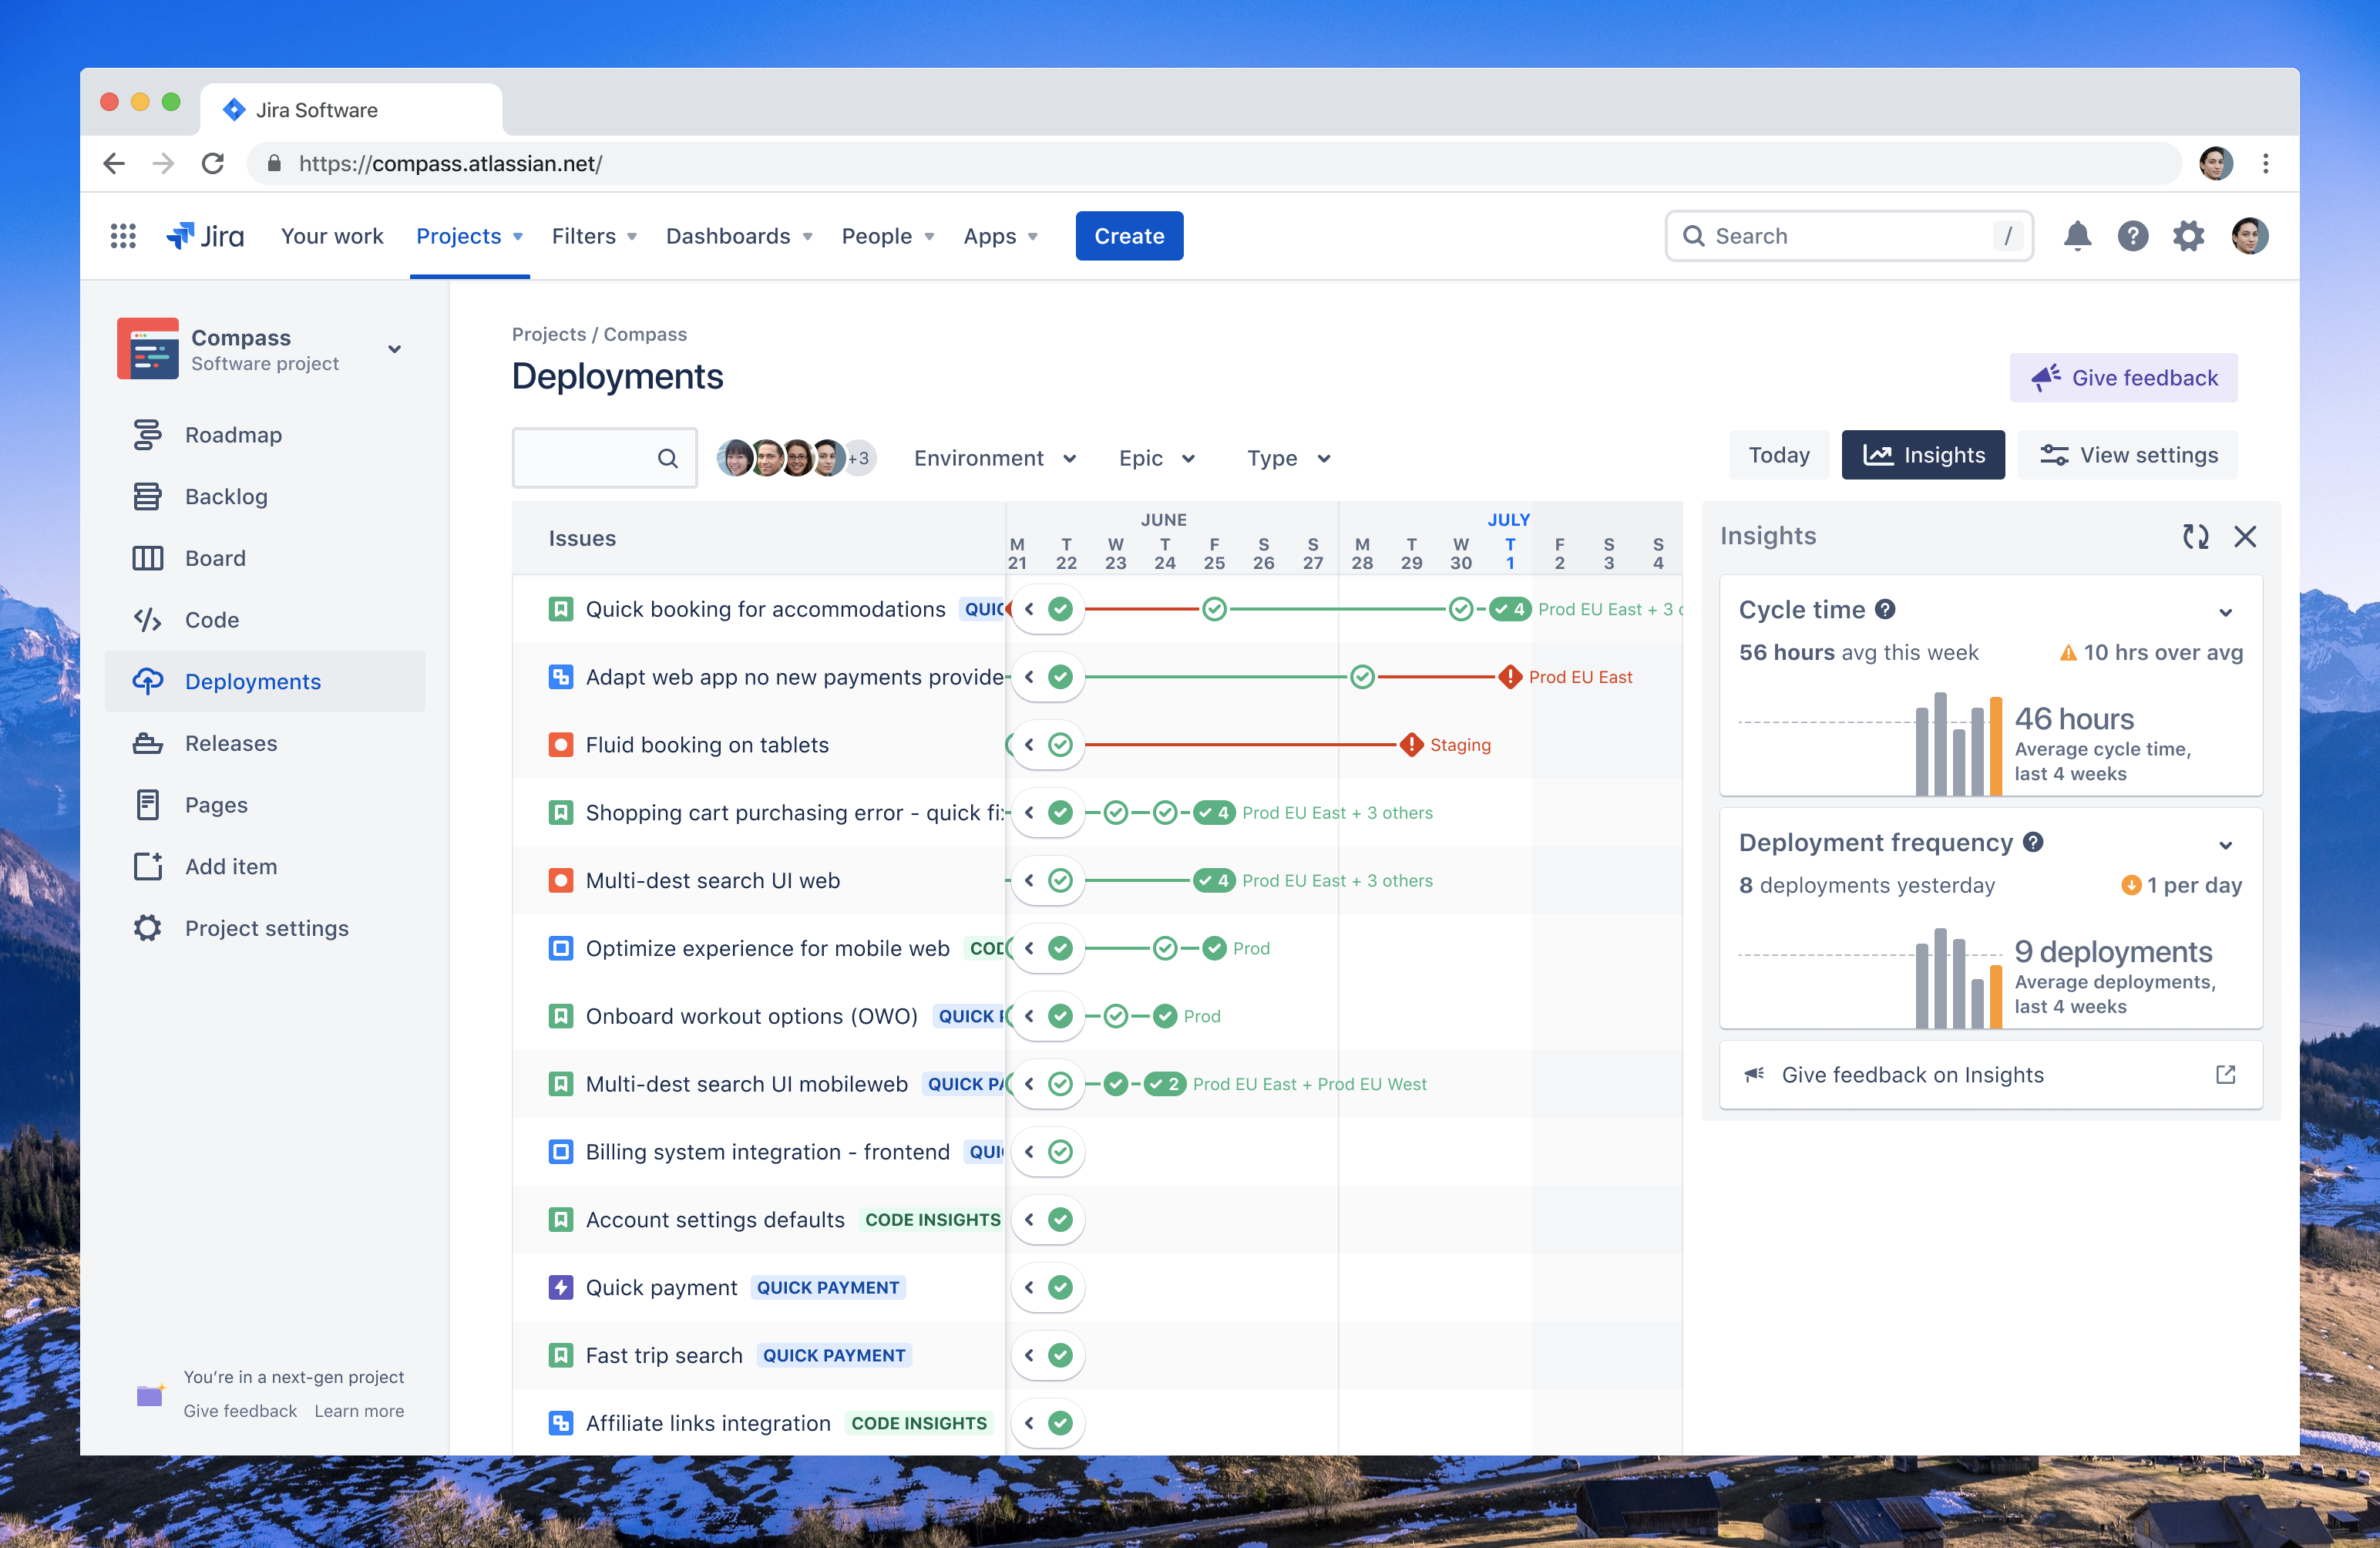
Atlassian is launching an update to its ubiquitous Jira issue and project tracking service today — and specifically the Jira Software Cloud version — that brings a number of new features for visualizing and measuring how code moves through the development pipeline. With this, project managers and developers will be able to get deeper insights into the code teams are working on, for example, and where that code is in the deployment pipeline. Users of Jira Software Premium will also be able to track deployment frequency and cycle times right inside of the service now, too.
“In the quest to reach that near-mythical land of ‘insights,’ many teams mistake consolidation for control. But the challenge is not the number of tools; it’s the way they’re integrated,” the Jira team writes in today’s announcement. “No single vendor will ever deliver all the products an agile software team needs, so the burden still lies on the team to manually connect the dots.”
This update, Atlassian argues, helps those teams do just that. For most teams, Jira is already the central repository where each piece of work is documented in some form or another, after all. Some of that work happens in Atlassian tools, but most of it happens in the context of third-party services. The idea here is to pull all of this DevOps work together and provide more visibility and insights into the state of a company’s development pipeline.
Specifically, there are four different updates here. The first is ‘code in Jira,’ which may sound like you can now code inside of Jira, but in reality, it’s about seeing which repos in Bitbucket, GitHub, GitLab or Git Integration for Jira are currently actively worked on. With the new ‘deployments’ feature, users can now get a real-time view of all of their deployment information across CI/CD services like Bitbucket Pipelines, Jenkins, Azure DevOps, Circle CI, Octopus Deploy and JFrog.
“Whether you’re a product manager looking to see which features have deployed to which environment or a team lead looking to understand the average time it takes for your team to go from idea to production within a certain project, you’ll find your answer in the Deployments in Jira tab,” the company explains.
The last two features, only available in the pricier and more enterprisey Jira Software Premium, will soon provide more in-depth metrics about deployment frequency and cycle times. The idea here is simply to provide more metrics to help teams better understand trends and identify outliers in their processes.


