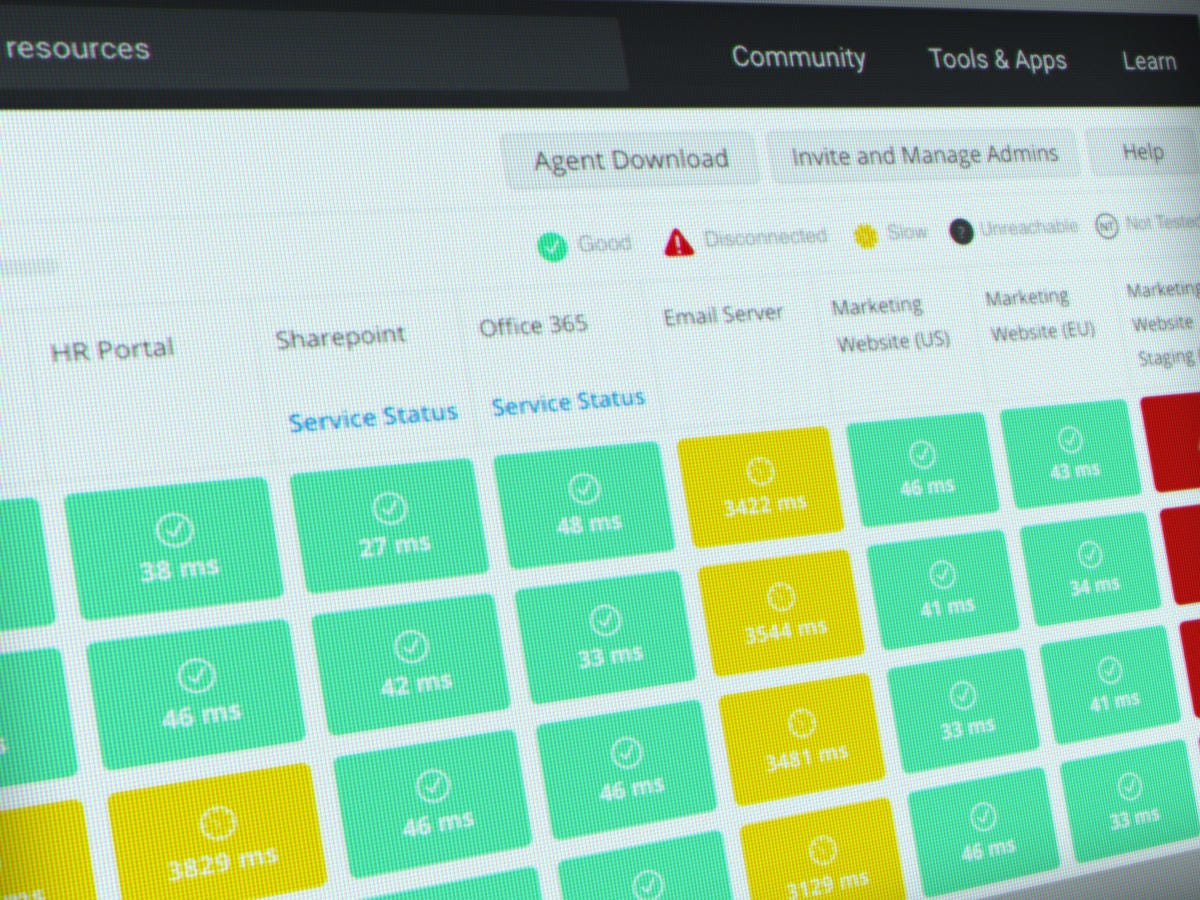
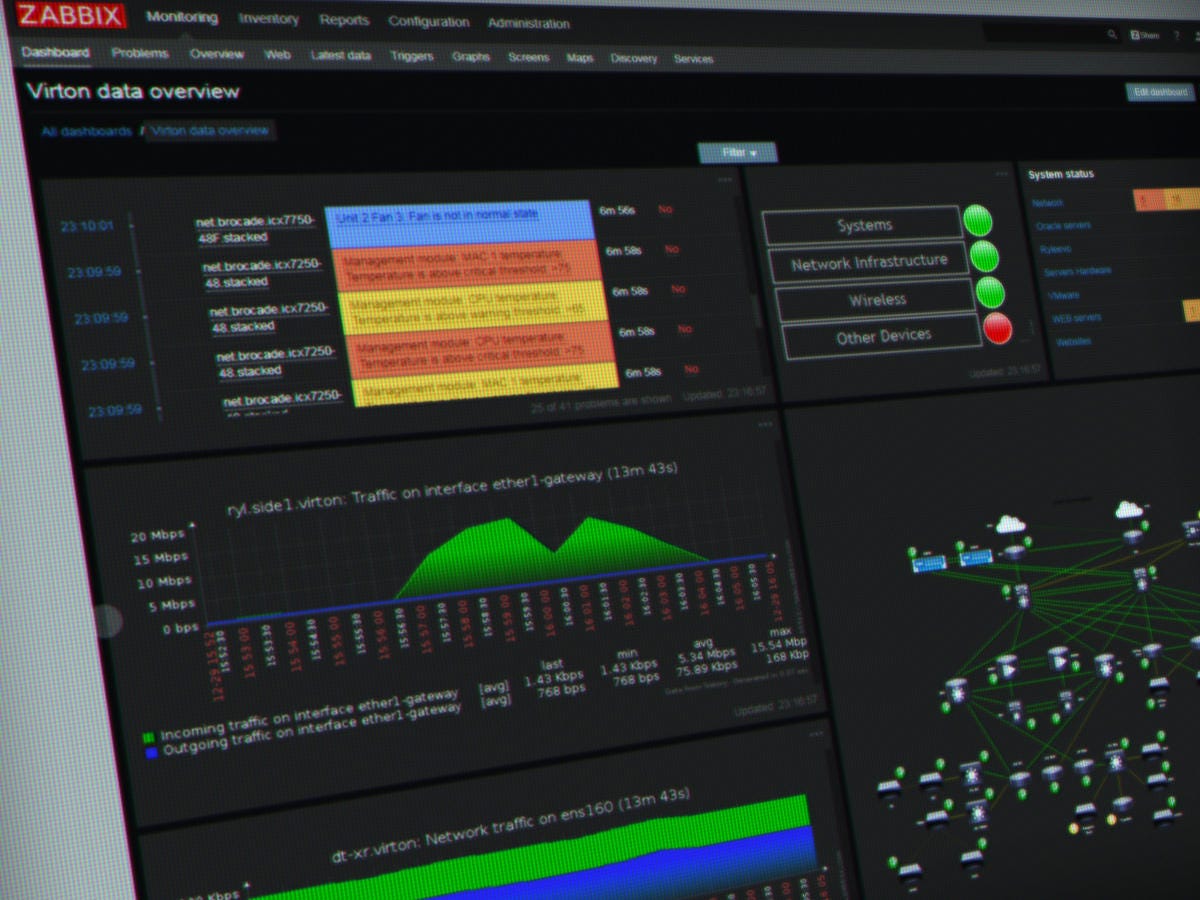
When you manage a large network, nothing is worse than servers that fail. Well, that’s not completely true. Nothing is worse than servers that fail — and you don’t know they’ve failed. Hmm… even that’s not completely true. Nothing is worse than servers that fail, and once you find out they’ve failed, you can’t figure out why. That’s a formula for a very unpleasant day.
Since I’m not the only one who’s woken up (or been woken up) to a deteriorating server farm, an entire industry of server and network monitoring tools exists out there. This category is called RMM (or remote monitoring and management). At their core, most tools will identify the devices on your network and provide status as to whether those devices are up or down. Some tools can trigger alerts. Some tools allow you to manage licenses. Other tools build up diagnostic and analytics data to dig into what’s going on. And, more recently, some tools have added machine learning technologies to help augment IT professionals’ skills in tracking down problems.
We’ve selected a baker’s dozen of such tools and present them to you here.
RMM for managed service providers
Atera takes the process of RMM (remote monitoring and management) and tunes it for MSPs (managed service providers). By combining remote management with customer service functions like ticketing and satisfaction surveys, Atera helps you stay on top of your network — and your customer relationships.
Atera offers the normal RMM fare like network discover, real-time alerts, remote access, and mobile apps, and then adds contract and SLA (service level agreement) management, and billing and invoicing support (with integrations to QuickBooks, Xero, and Freshbooks). If you want to grow your MSP business, control costs, and present a professional image, Atera is a great beginning.
Optimized RMM automation
ConnectWise Automate allows you to monitor and maintain your entire network from a single browser screen. The main interface allows you to see all your devices, group them by logical categories, and perform operations on them, either one-by-one or in a batch. It’s also possible to get an at-a-glance feel for each group through clear icons and comprehensive filters that let you see both individual and overall machine status.
One of ConnectWise Automate’s key benefits is the ability to patch third-party applications as easily as operating system assets — often without requiring any attention from a user or device owner. But it’s the automation and scripting support that really takes ConnectWise Automate to the next level. You can build a comprehensive set of custom scripts that allow you to manage, patch, and configure all aspects of your network from just a few clicks.
Cloud monitoring as a service — woof!
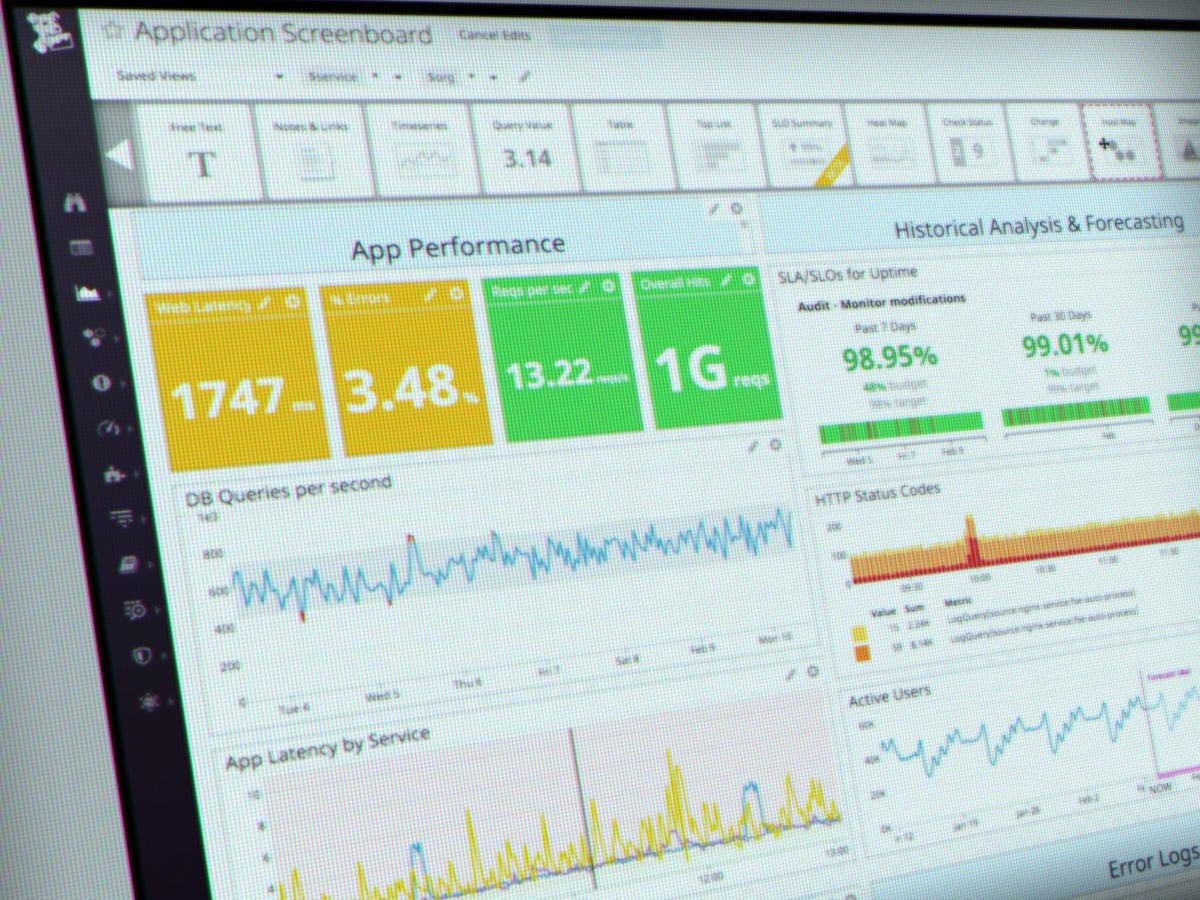
Datadog is a fascinatingly deep network monitoring and analytics tool designed for modern, multi-vendor cloud networks. Datadog boasts a tremendous list of cloud integrations that can report data to and work in context with Datadog’s recording, reporting, and analytics engine.
Use Datadog to get a look inside applications and explore log data, monitor traffic flow and user experience, set alerts to let you know of potential failure points, and use Datadog’s machine learning capability to surface issues you might not otherwise have been aware of. If you’ve got a network or application problem in need of troubleshooting, using Datadog in concert with other debugging tools to dig deep into performance history to locate and identify problems and fixes.
Open-source infrastructure monitoring
The icing on Incinga’s cake is that it’s open source and free to use. There is a company behind the product, but they make their money selling support subscriptions, not product licenses. That means, unlike many of the other remote monitoring solutions shown here, you’re not penalized for growth. Whether you choose to monitor five, five hundred, or five thousand machines, there’s no per-device fee.
Icinga does charge for support subscriptions and they do meter their pricing by availability (weekdays during work hours or 24/7), the number of support cases, and the number of Icinga servers you’re running. But they don’t meter the number of devices you monitor. In addition to the basic monitoring engine and the browser-based dashboard, Icinga has a number of available modules that extend support to vSphere, certificate monitoring, business process monitoring, and more.
Cloud-based infrastructure monitoring platform
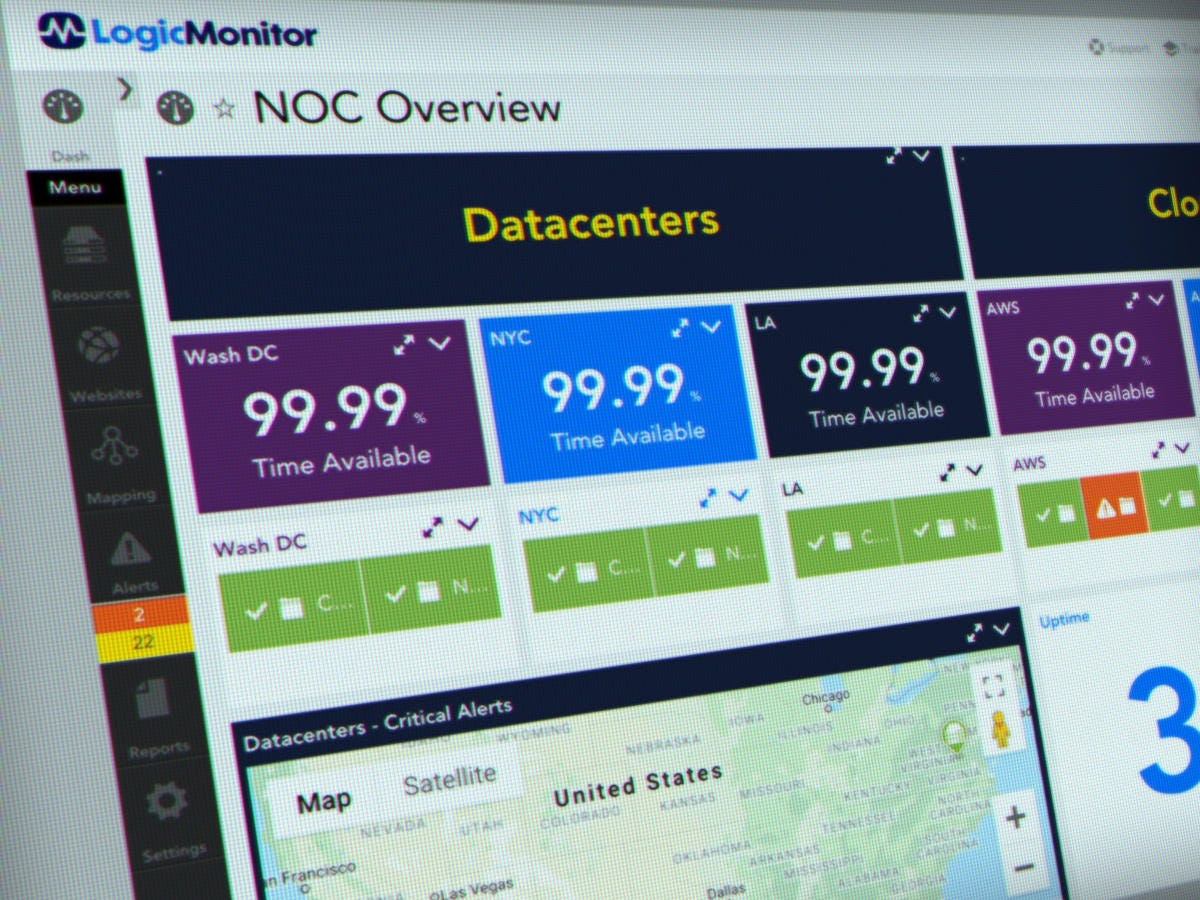
The first thing that struck me about LogicMonitor was its astounding number of infrastructure and cloud app integrations — numbering well over 2,000. LogicMonitor pitches itself to both enterprise IT organizations and service providers, providing full-stack monitoring across an entire multi-vendor, multi-solution network.
The key to LogicMonitor is that it starts with a basic core deployment package, and builds on top of that. At its core, it does hybrid-cloud infrastructure performance monitoring, in concert with that massive array of integrations we discussed earlier. Beyond that are automation features, AI-based early warning features, configuration monitoring systems, and considerably more. Pricing is based on features, support level, and number of devices you choose to incorporate in your solution.

If you want to monitor just three network devices, you can use OpManager’s Free Edition. You get the ability to monitor critical network metrics, server availability, and VMs, and set alerts and alarms. But if you want to go beyond three devices (and you will, won’t you?), then you need to get the commercial edition of OpManager.
While OpManager does all the usual real-time networking monitoring and physical and virtual server monitoring you’d expect from a product of this class, what we’re quite excited about is the multi-level thresholds you can set that allow you to stage and scale alerts depending on your specific situation. Another neat feature, as you move up into pro and enterprise editions, is the ability to visualize all your physical racks in a slick 3D view.
Pretty much the most popular monitoring software on the planet
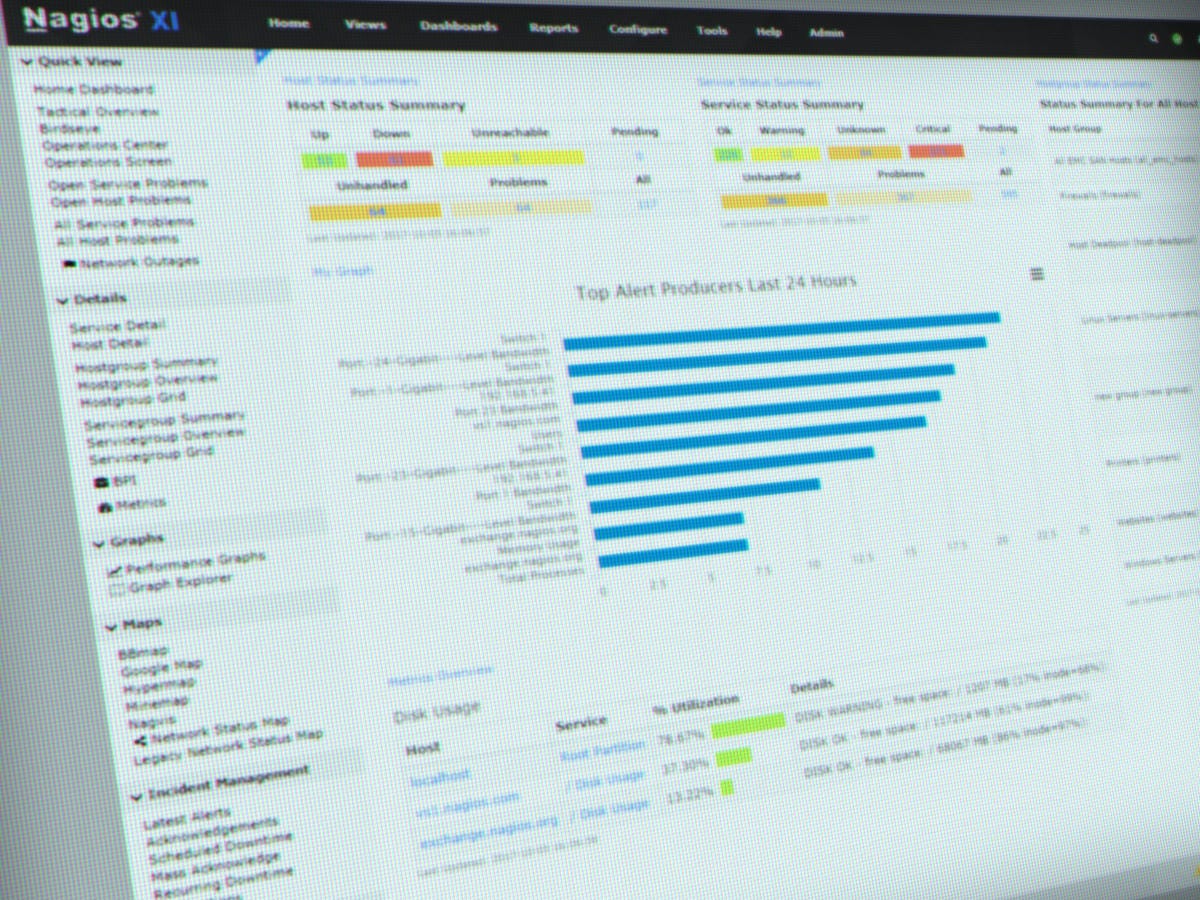
Nagios stands out because it is, in many IT managers’ eyes, network monitoring. Nagios was network monitoring before network monitoring was cool. It’s open source (which means you’re not plunking down the thousands of dollars its competitors require), it’s incredibly powerful, and it’s nearly ubiquitous.
There is a commercial version of Nagios, called Nagios XI. Nagios XI comes in standard and enterprise editions (for about $2,000 and $3,500 respectively). Nagios XI adds to the power of the Nagios core, but also makes it more accessible and less difficult to use. There are advanced reporting features, enhanced visualizations, summary reports, custom actions, and — in the enterprise version, capacity planning reports, audit logging, SAL reports, and more.
Network dashboard with some smart physical monitoring as well
PRTG Network Monitor is a product of Paessler AG. The PRTG stood for Paessler Router Traffic Grapher, which was the product’s name until version 7. The current product is an agentless network monitoring product that uses the standard protocols built into the devices it monitors.
One interesting feature of PRTG is the integration of a mobile app in a datacenter environment. While there’s a central dashboard available for monitoring all the devices in the network, an IT tech can drill down to the specific hardware device currently being examined. PRTG uses QR codes affixed to physical devices to allow techs to call up stats on individual machines. Pricing is based on the number of sensors being deployed, ranging from $1,700 for 500 sensors up to $15,500 for unlimited sensors on one server. More servers can cost more, so check with the company.
All-in-one monitoring that digs deep into application functionality
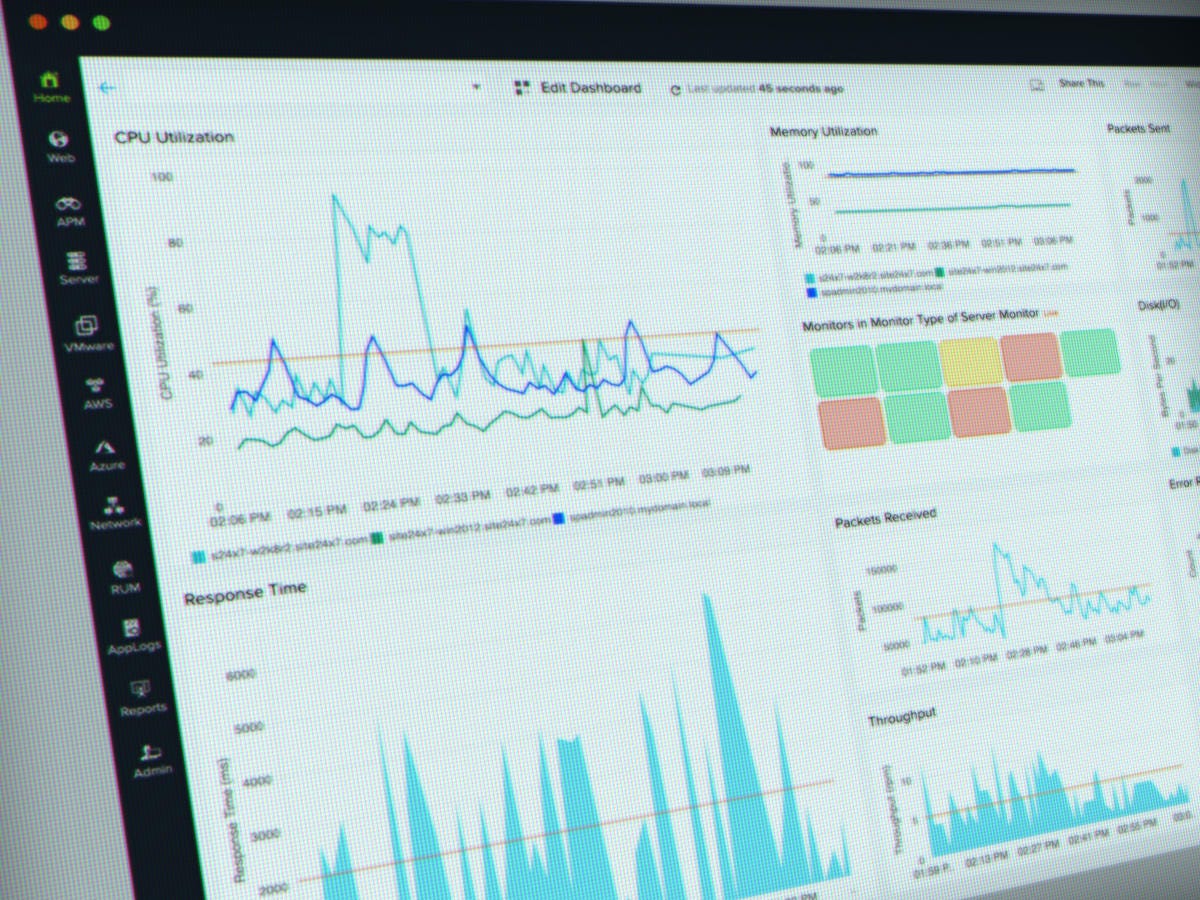
Site24x7’s claim to fame is it monitors a lot more than websites. It monitors servers, application performance, network devices, and even user experience. Of most interest is the user experience module, which is powered by a small JavaScript embedded onto your application web pages. This module allows you to monitor performance, pinpoint JavaScript errors, measure and monitor AJAX requests, and more.
The insights that are possible when combining IP-level monitoring with workload process monitoring can well be profound. By being able to see not only the overall network and individual hardware/VM devices, but actual workload performance inside the applications, it’s possible to spotlight, tune, and resolve challenging performance problems.
Totally free network monitoring without all those pesky alerts (yet)
Spiceworks is an odd company in that it generates most of its revenue from ads. On the surface, that wouldn’t seem so odd because…the entire Internet. But Spiceworks builds non-open-source, professional-level software like Spiceworks Network Monitor and makes it available for free. This puts the companies products somewhere between shareware and ad-supported.
While Spiceworks Network Monitor isn’t quite as capable of a network monitor as the others we’ve surveyed in this article, it does get the basics right. To that end, Spiceworks Network Monitor provides you with a consolidated dashboard, distributed checks of critical network apps, and hardware/software device status. What Spiceworks doesn’t have is dynamic alerts (although the company says they’re coming), patch management, license management, and some of the more enterprise-level tasks. But hey, the software is free (and so is the support), so what’s not to love?
Highly customizable and configurable, but Windows-only
OK, let’s be clear: WhatsUp and WhatsApp are not the same things. One is a messaging platform that alerts you to when your servers are failing, while the other is a messaging platform that alerts you to when your friends’ relationships are failing.
WhatsUp Gold provides a full suite of network availability and performance monitoring tools, including network mapping, performance modeling, wireless network status, application performance, cloud monitoring, and configuration management, along with real-time alerts and customized workflows. We particularly like how WhatsUp Gold has integrated REST API within the product so you can make WhatsUp a part of a larger integrated solution.
That said, we do think WhatsUp Gold did miss a golden opportunity because the company’s pricing levels are called Premium and Total Plus instead of, say, Bronze, Silver, Gold, and Platinum. Licensing is device-based, so the more nodes you have, the more you’re going to pay.
Free, open-source network monitoring
Zabbix is another open-source project whose parent company uses paid support as its income source. The open-source GPL code has been in use for 20+ years now, with an internal release in 1998 and the first alpha GPL release in 2001.
Key to Zabbix is its monitoring capacity. It can easily monitor thousands of devices (and since you’re not paying by devices, that can be incredibly cost-effective). It can perform auto-discovery across a range of environments (although Windows does require the installation of some agent software). It also offers deep reporting metrics, including SLA and ITIL (IT Infrastructure Library) KPI (key performance indicator) metrics, along with a business-level view of monitored resources.
Community and commercial cloud and on-prem monitoring
Zenoss Cloud takes yet another approach to business models. In this case, Zenoss has a free, community edition of the Zenoss Cloud software that is fully usable, as well as an enterprise edition that has the full support of ongoing commercial development.
Both platforms offer network device monitoring, network service monitoring, host resource monitoring, event management tools, automatic discovery, rule-based alerts, and even support for the Nagios plugin format. Commercial offerings add full-stack capabilities for enterprise-level monitoring, anomaly detection, related entity detection, and machine learning.
Our process
I have personal experience with the open-source tools, and so those were easy for me to recommend. We also reached out to IT professionals and did a literature review of other reviews to determine the tools to recommend to you. We eliminated a few popular tools that haven’t been updated in a few years and optimized for tools that would work in both an on-premises and cloud environment.
All told, we found 14 tools we feel we can confidently recommend.
How to choose
While every IT environment has unique requirements, we recommend you initially examine these tools based on two key vectors: Price per node and depth of hybrid solution.
When it comes to costing out a solution, many of these tools charge based on how many devices you’re monitoring and/or how many servers you’re running to do the monitoring. As the number of devices grows (especially if you’re also monitoring IoT devices), the cost-per-device can climb exorbitantly. So keep that in mind.
Some of these tools work best on-premises and others can query into the cloud. Some of them use existing protocols, while others require agents to shout back monitoring status information. Keep in mind that if you’re running on a SaaS environment, many SaaS solutions won’t allow the installation of outside agents, so you’ll need to find tools that work specifically with your environment. Some of the tools we recommend have custom integrations with many of the popular the SaaS and IaaS cloud products out there, so keep an eye out as you’re making your evaluation.
My recommendation would be to optimize for solutions that let you try before you buy or that offer a money-back guarantee. My experience with monitoring solutions is you never really know how they’re going to fit for your needs until you run them for a while, and until you get some alerts — or miss some alerts that you should have gotten. Work with these as much as you can before you commit to an expensive solution.
You can follow my day-to-day project updates on social media. Be sure to follow me on Twitter at @DavidGewirtz, on Facebook at Facebook.com/DavidGewirtz, on Instagram at Instagram.com/DavidGewirtz, and on YouTube at YouTube.com/DavidGewirtzTV.


