In addition to our Community Standards Enforcement Report, this quarter we’re also sharing:
Today we’re publishing our Community Standards Enforcement Report for the first quarter of 2021. This report provides metrics on how we enforced our policies from January through March, including metrics across 12 policies on Facebook and 10 on Instagram.
The new Transparency Center is a single destination for our integrity and transparency efforts. It includes information on:
We’ll continue to add more information and build out the Transparency Center as our integrity efforts continue to evolve.
Last year we committed to undergoing an independent audit to validate that our metrics are measured and reported correctly. We have selected EY to conduct this assessment, and we look forward to working with them.
Community Standards Enforcement Report Highlights
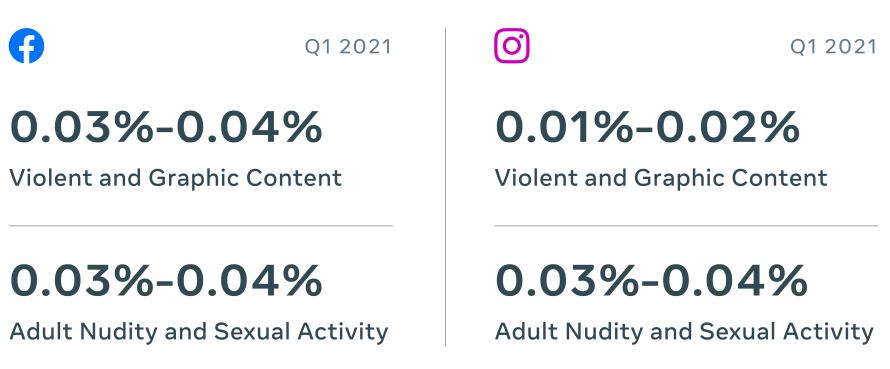
Prevalence is one of the most useful metrics for understanding how often people see harmful content on our platform, so in this report, we’re expanding prevalence metrics on Instagram to include the prevalence of adult nudity and violent and graphic content.
In Q1 of 2021, the prevalence of adult nudity on both Facebook and Instagram was 0.03-0.04%. Violent and graphic content prevalence was 0.01-0.02% on Instagram. On Facebook, it was 0.03-0.04%, down from .05% last quarter. We’re working to share more data and match the metrics we share across both Facebook and Instagram. That’s why we’re releasing these prevalence numbers for the first time, and we’ll continue to share them each quarter to track our progress.
Progress on Hate Speech
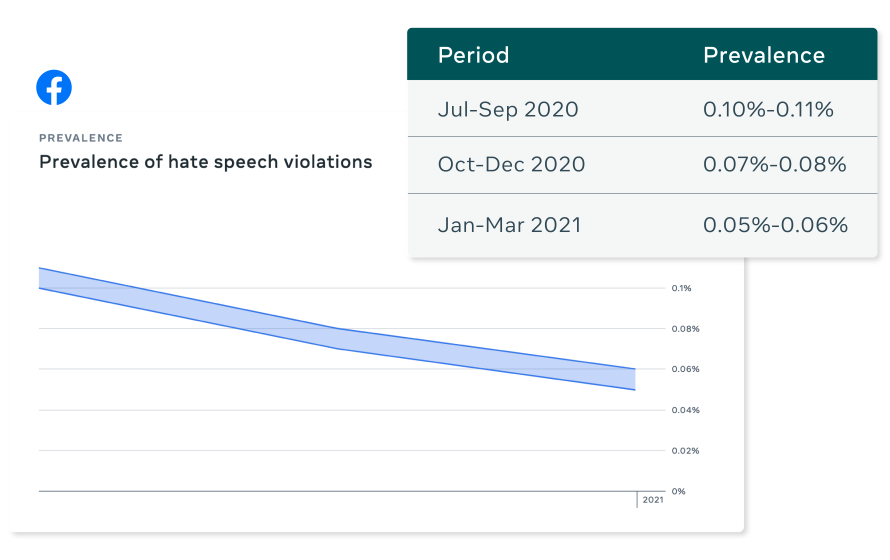
Prevalence of hate speech on Facebook continues to decrease. In Q1, it was 0.05-0.06%, or 5 to 6 views per 10,000 views.
We evaluate the effectiveness of our enforcement by trying to keep the prevalence of hate speech on our platform as low as possible, while minimizing mistakes in the content that we remove. This improvement in prevalence on Facebook is due to changes we made to reduce problematic content in News Feed.
Advancements in AI technologies have allowed us to remove more hate speech from Facebook over time, and find more of it before users report it to us. When we first began reporting our metrics on hate speech in Q4 of 2017, our proactive detection rate was 23.6%. This means that of the hate speech we removed, 23.6% of it was found before a user reported it to us. The remaining majority of it was removed after a user reported it. Today we proactively detect about 97% of hate speech content we remove.
Recent Trends
In addition to new metrics and ongoing improvements in prevalence, we saw steady numbers on the content we took action on across many problem areas.
On Facebook in Q1 we took action on:
- 8.8 million pieces of bullying and harassment content, up from 6.3 million in Q4 2020 due in part to improvements in our proactive detection technology
- 9.8 million pieces of organized hate content, up from 6.4 million in Q4 2020
- 25.2 million pieces of hate speech content, compared to 26.9 million in Q4 2020
On Instagram in Q1 we took action on:
- 5.5 million pieces of bullying and harassment content, up from 5 million in Q4 2020 due in part to improvements in our proactive detection technology
- 324,500 pieces of organized hate content, up from 308,000 in Q4 2020
- 6.3 million pieces of hate speech content, compared to 6.6 million in Q4 2020
Combating COVID-19 Misinformation and Harmful Content
COVID-19 continues to be a major public health issue, and we are committed to helping people get authoritative information, including vaccine information. From the start of the pandemic to April 2021, we removed more than 18 million pieces of content from Facebook and Instagram globally for violating our policies on COVID-19-related misinformation and harm. We’re also working to increase vaccine acceptance and combat vaccine misinformation.
:


