Ministry of Petroleum & Natural Gas

Monthly Production Report July 2022
Posted On: 23 AUG 2022 1:50PM by PIB Delhi
- Production of Crude Oil
Crude oil production during July 2022 was 2453.19 TMT, which is 5.57% lower than target for the month and 3.76% lower than the production of July 2021. Cumulative crude oil production during April-July, 2022 was 9912.42 TMT, which is 2.17% lower than target for the period and 0.50% lower than production during corresponding period of last year respectively. Unit-wise and State-wise crude oil production is given at Annexure-I. Unit-wise crude oil production for the month of July 2022 and cumulatively for April-July 2021-22 vis-à-vis same period of last year has been shown in Table-1 and month-wise in Figure-1.
Table-1: Crude Oil Production (in TMT)
|
Oil Company |
Target |
June (Month) |
April-June (Cumulative) |
||||||
|
2022-23 (Apr-Mar)* |
2022-23 |
2021-22 |
% over last year |
2022-23 |
2021-22 |
% over last year |
|||
|
Target* |
Prod.* |
Prod. |
Target* |
Prod.* |
Prod. |
||||
|
ONGC (Nomination Block) |
19869.61 |
1693.39 |
1636.56 |
1664.94 |
98.30 |
6681.23 |
6606.19 |
6477.08 |
101.99 |
|
OIL (Nomination Block) |
3571.00 |
286.99 |
263.70 |
253.26 |
104.12 |
1091.47 |
1037.55 |
995.60 |
104.21 |
|
Pvt/JVs (PSC/RSC Regime) |
7400.88 |
617.44 |
552.92 |
630.77 |
87.66 |
2359.91 |
2268.68 |
2489.29 |
91.14 |
|
Total |
30841.49 |
2597.82 |
2453.19 |
2548.98 |
96.24 |
10132.62 |
9912.42 |
9961.97 |
99.50 |
- Note: Totals may not tally due to rounding off. *: Provisional
Figure-1: Monthly Crude Oil Production

Unit-wise production details with reasons for shortfall are as under:
- Crude oil production by ONGC (Oil and Natural Gas Corporation) in nomination block during July 2022 was 1636.56 TMT, which is 3.36% lower than target of the month and 1.70% lower when compared with production of July 2021. Cumulative crude oil production by ONGC during April-July, 2022 was 6606.19 TMT, which is 1.12% lower than target for the period but 1.99% higher than target for the period and production during corresponding period of last year respectively. Reasons for shortfall in production are as under:
- Natural decline in production from Gandhar in Ankleshwar.
- Ceasure of high potential wells in Geleki field in Assam.
- Closure of wells due to DAB issues.
- Less contribution from PEC fields in Jorhat.
- Restriction on drilling activities due to socio-political issues in Cauvery.
- Crude oil production by OIL (Oil India Ltd) in the nomination block during July 2022 was 263.70 TMT, which is 8.11% lower than the target of the month but 4.12% higher when compared with production of July, 2021. Cumulative crude oil production by OIL during April-July 2022 was 1037.55 TMT, which is 4.94% lower than target for the period but 4.21% higher when compared production during corresponding period of last year. Reasons for shortfall in production are as under:
- Less than planned contribution from workover wells.
- Loss due to miscreant activities in Main Producing Area (MPA).
- Crude oil production by Pvt/JVs companies in the PSC/RSC regime during July 2022 was 552.92 TMT, which is 10.45% lower than the target of the reporting month and 12.34% lower than the month production of July 2021. Cumulative crude oil production by Pvt/JVs companies during April-July 2022 was 2268.68 TMT, which is 3.87% and 8.86% lower than target for the period and production during corresponding period of last year respectively. Reasons for shortfall in production are as under:
- RJ-ON-90/1 (VEDANTA): Production shortfall due to Few well failures in ABH & NL; Well failures and higher injection losses to de risk infill drilling in Bhagyam. Some well shut-in due to SRP pump issues in Guda, Kaameshwari West, Raaggeshwari Oil.
- CB-OS/2 (VEDANTA): Shortfall due to non-realization of production anticipated from upcoming development wells.
- MB/OSDSF/B80/2016 (HOEC): Production shortfall due to D1 well is shut-in due to operational issues and D2 well is shut due to chafe change out operation, delayed due to very bad weather conditions.
- RAVVA (VEEDANTA): Production shortfall due to Well RB-3 ST ceased to flow because of liquid loading.
- CB-ONN-2003/1 (SUN): Production shortfall due to delay in drilling of additional proposed wells and crude evacuation constraint.
- Production of Natural Gas
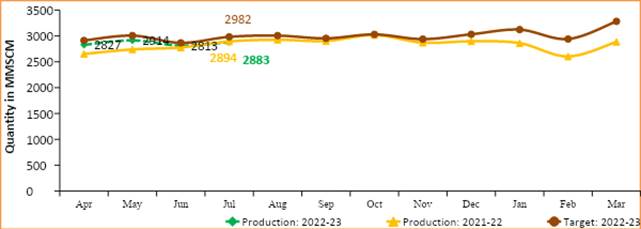
Natural gas production during July 2022 was 2882.54 MMSCM, which is 3.33% lower than the monthly target and 0.40% lower than production of July 2021. Cumulative natural gas production during April-July 2022 was 11436.19 MMSCM, which is 2.80% lower when compared with target for the period but 3.38% higher than production during corresponding period of last year. Unit-wise and state-wise natural gas production is given at Annexure-II. Unit-wise natural gas production for the month of July 2022 and cumulatively for April-July 2021-22 vis-à-vis same period of last year has been shown in Table-2 and month-wise in Figure-2.
Table-2: Natural Gas Production (in MMSCM)
|
Oil Company |
Target |
June (Month) |
April-June (Cumulative) |
||||||
|
2022-23 (Apr-Mar)* |
2022-23 |
2021-22 |
% over last year |
2022-23 |
2021-22 |
% over last year |
|||
|
Target* |
Prod.* |
Prod. |
Target* |
Prod.* |
Prod. |
||||
|
ONGC (Nomination Block) |
20381.94 |
1697.07 |
1662.89 |
1730.66 |
96.08 |
6773.82 |
6749.44 |
6782.59 |
99.51 |
|
OIL (Nomination Block) |
3717.84 |
316.35 |
262.53 |
248.41 |
105.69 |
1241.14 |
1005.32 |
923.61 |
108.85 |
|
Pvt/JVs (PSC/RSC Regime) |
11968.32 |
968.43 |
957.12 |
915.08 |
104.59 |
3750.74 |
3681.43 |
3356.10 |
109.69 |
|
Total |
36068.10 |
2981.85 |
2882.54 |
2894.15 |
99.60 |
11765.69 |
11436.19 |
11062.30 |
103.38 |
Note: Totals may not tally due to rounding off. *: Provisional
Figure-2: Monthly Natural Gas Production

- Natural gas production by ONGC (Oil and Natural Gas Corporation) in the nomination blocks during July 2022 was 1662.89 MMSCM, which is 2.01% lower target for the month and 3.92% lower than the production of July 2021. Cumulative natural gas production by ONGC during April-July, 2022 was 6749.44 MMSCM, which is 0.36% and 0.49% lower than target for the period and production during corresponding period of last year respectively.
- Less gas production in Daman field in B&S Asset due to more than anticipated decline.
- Delay in HF in Mandapeta & Natural Decline in Pasarlapudi and Kesanapalli-W fields in Rajahmundry.
- Potential decline and ceasure of wells in Gandhar, Jambusar and Dahej fields in Ankleshwar Asset.
- Decline in AG in Geleki field & FG in Laiplingaon field in Assam Asset.
- Consumer issues in Tripura.
- Restriction on drilling activities due to socio-political issues in Cauvery.
- Natural gas production by OIL (Oil India Ltd) in the nomination block during July 2022 was 262.53 MMSCM which is 17.01% lower than the target for the month of current year but 5.69% higher than production of corresponding month of last year. Cumulative natural gas production by OIL during April-July 2022 was 1005.32 MMSCM, which is 19.0% lower than target for the period but 8.85% higher than production during corresponding period of last year. Reasons for shortfall in production are as under:
- Low upliftment/demand of gas by the major customers.
- Less than planned contribution from drilling wells and old wells.
- Natural gas production by Pvt/JVs companies in the PSC/RSC/CBM regime during July 2022 was 957.12 MMSCM, which is 1.17% lower than the target for the month but 4.59% higher when compared the production of July 2021. Cumulative natural gas production by Pvt/JVs during April-July, 2022 was 3681.43 MMSCM, which is 1.85% lower than target for the period but 9.69% higher than production during corresponding period of last year. Reasons for shortfall in production are as under:
- AAP-ON-94/1 (HOEC): Production Shortfall due to Low consumer demand.
- CB-OS/2 (VEDANTA): Shortfall due to non-realization of production anticipated from upcoming development wells.
- MB/OSDSF/B80/2016 (HOEC): Production shortfall due to D1 well is shut-in due to operational issues and D2 well is shut due to chafe change out operation, delayed due to very bad weather conditions.
- RAVVA (VEDANTA): Production shortfall due to Well RB-3 ST ceased to flow because of liquid loading.
- Crude Oil Processed (Crude Throughput)
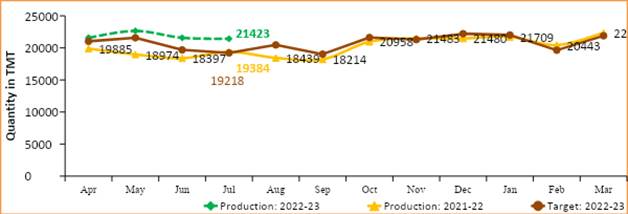
Crude Oil Processed during July 2022 was 21423.25 TMT, which is 11.47% higher than target for the month and 10.52% higher than the July 2021. Cumulative crude processed during April-July 2022 was 87221.33 TMT, which is 7.02% and 13.81% higher than target for the period and production during corresponding period of last year respectively. Refinery-wise details of the crude throughput and capacity utilization during the month of July 2022 vis-à-vis July 2021 are given at Annexure-III and Annexure-IV. Company-wise crude throughput for the month of July 2021 and cumulatively for the period April-July 2022 vis-à-vis same period of last year has been shown in Table-3 and month-wise in Figure-3.
Table 3: Crude Oil Processed (Crude Throughput) (in TMT)
|
Oil Company |
Target |
June (Month) |
April-June (Cumulative) |
||||||
|
2022-23 (Apr-Mar)* |
2022-23 |
2021-22 |
% over last year |
2022-23 |
2021-22 |
% over last year |
|||
|
Target* |
Prod.* |
Prod. |
Target* |
Prod.* |
Prod. |
||||
|
CPSE |
154983.78 |
11545.43 |
13096.53 |
11582.90 |
113.07 |
50224.45 |
54415.99 |
44884.00 |
121.24 |
|
IOCL |
69999.90 |
4408.89 |
6167.19 |
5667.63 |
108.81 |
22501.19 |
25103.66 |
22389.06 |
112.12 |
|
BPCL |
37000.00 |
3100.00 |
2699.54 |
2962.65 |
91.12 |
12475.00 |
12259.42 |
11269.60 |
108.78 |
|
HPCL |
18920.85 |
1556.50 |
1560.32 |
799.64 |
195.13 |
5806.60 |
6369.87 |
3307.65 |
192.58 |
|
CPCL |
10300.00 |
930.00 |
975.07 |
818.56 |
119.12 |
3360.00 |
3857.31 |
2853.07 |
135.20 |
|
NRL |
2800.00 |
244.51 |
261.08 |
226.90 |
115.06 |
962.25 |
1047.69 |
866.92 |
120.85 |
|
MRPL |
15900.00 |
1300.00 |
1428.36 |
1104.62 |
129.31 |
5100.00 |
5753.50 |
4175.10 |
137.81 |
|
ONGC |
63.04 |
5.53 |
4.98 |
2.91 |
170.88 |
19.40 |
24.53 |
22.61 |
108.49 |
|
Pvt/JVs |
94637.83 |
7672.96 |
8326.72 |
7801.52 |
106.73 |
31276.99 |
32805.35 |
31756.27 |
103.30 |
|
HMEL |
11451.93 |
969.61 |
1109.49 |
1098.17 |
101.03 |
3843.11 |
4339.01 |
4322.39 |
100.38 |
|
RIL |
63021.49 |
5026.62 |
5482.43 |
5026.62 |
109.07 |
20782.14 |
21666.43 |
20782.14 |
104.26 |
|
NEL |
20164.41 |
1676.74 |
1734.80 |
1676.74 |
103.46268 |
6651.75 |
6799.91 |
6651.75 |
102.2274 |
|
TOTAL |
249621.61 |
19218.39 |
21423.25 |
19384.42 |
110.52 |
81501.44 |
87221.33 |
76640.28 |
113.81 |
- Totals may not tally due to rounding off. *: Provisional
Figure 3: Crude Oil Processed (Crude Throughput)

3.1 CPSE Refineries’ crude oil processed during July 2022 was 13096.53 TMT, which is 13.43% higher than target for the month and 13.07% higher than the production of July 2021. Cumulative crude throughput during April-July 2022 was 54415.99 TMT which is 8.35% and 21.24% higher than target for the period and production during corresponding period of last year respectively. Reasons for shortfall in production are as under:
- IOCL-Panipat Refinery: Crude processed lower due to high TAN crude processing; partial power failure and VGO ullage constraint due to RFCC shutdown.
- HPCL-Visakh: Crude processed lower due to planned shutdown.
3.2 Private & JVs Refineries’ crude oil processed during July 2022 was 8326.72 TMT, which is 8.52% higher than the target for the month and 6.73% higher than the production of July 2021. Cumulative crude throughput during April-July 2022 was 32805.35 TMT, which is 4.89% and 3.30% higher than target for the period and production during corresponding period of last year respectively.
- Production of Petroleum Products
- Production of Petroleum Products during July 2021 was 21974.60 TMT, which is 7.85% higher target for the month and 6.23% higher than the production of July 2021. Cumulative production during April-July, 2022 was 90095.08 TMT, which is 6.65% and 11.67% higher than target for the period and production during corresponding period of last year respectively. Unit-wise production of petroleum products is given at Annexure-V. Company-wise production for the month of July 2022 and cumulatively for April-July, 2022 vis-à-vis same period of last year has been shown in Table-4 and month-wise in Figure-4.
Table 4: Production of Petroleum Products (TMT)
|
Oil Company |
Target |
June (Month) |
April-June (Cumulative) |
||||||
|
2022-23 (Apr-Mar)* |
2022-23 |
2021-22 |
% over last year |
2022-23 |
2021-22 |
% over last year |
|||
|
Target* |
Prod.* |
Prod. |
Target* |
Prod.* |
Prod. |
||||
|
CPSE |
144648.94 |
10756.99 |
12234.52 |
10892.82 |
112.32 |
46821.81 |
51028.32 |
42289.22 |
120.67 |
|
IOCL |
66322.30 |
4225.65 |
5903.44 |
5331.81 |
110.72 |
21373.80 |
23914.56 |
21296.13 |
112.30 |
|
BPCL |
34005.99 |
2844.02 |
2506.02 |
2852.96 |
87.84 |
11458.19 |
11521.61 |
10754.45 |
107.13 |
|
HPCL |
17495.57 |
1384.96 |
1449.92 |
745.04 |
194.61 |
5260.54 |
5861.93 |
3158.47 |
185.59 |
|
CPCL |
9614.24 |
867.94 |
871.42 |
776.22 |
112.27 |
3137.21 |
3575.42 |
2565.29 |
139.38 |
|
NRL |
2748.86 |
240.04 |
253.33 |
230.89 |
109.72 |
944.68 |
1060.52 |
835.49 |
126.93 |
|
MRPL |
14401.95 |
1189.11 |
1245.70 |
953.06 |
130.71 |
4628.92 |
5070.69 |
3657.84 |
138.63 |
|
ONGC |
60.02 |
5.27 |
4.70 |
2.84 |
165.47 |
18.47 |
23.60 |
21.55 |
109.50 |
|
Pvt/JVs |
111404.56 |
9285.23 |
9413.54 |
9433.69 |
99.79 |
36415.50 |
37826.47 |
37008.37 |
102.21 |
|
HMEL |
10528.86 |
888.63 |
944.12 |
1037.09 |
91.04 |
3505.94 |
3998.84 |
4098.80 |
97.56 |
|
RIL |
81492.18 |
6769.28 |
6748.38 |
6769.28 |
99.69 |
26487.28 |
27304.40 |
26487.28 |
103.08 |
|
NEL |
19383.52 |
1627.32 |
1721.04 |
1627.32 |
105.76 |
6422.28 |
6523.24 |
6422.28 |
101.57 |
|
Total Refinery |
256053.50 |
20042.22 |
21648.06 |
20326.51 |
106.50 |
83237.31 |
88854.79 |
79297.58 |
112.05 |
|
Fractionators |
3888.14 |
333.61 |
326.54 |
360.33 |
90.62 |
1237.35 |
1240.29 |
1381.99 |
89.75 |
|
TOTAL |
259941.64 |
20375.83 |
21974.60 |
20686.83 |
106.23 |
84474.66 |
90095.08 |
80679.57 |
111.67 |
Note: Totals may not tally due to rounding off. *: Provisional
Figure 4: Monthly Refinery Production of Petroleum Products

- Production of petroleum Products by Oil’s Refineries during July 2022 was 21648.06 TMT, which is 8.01% higher than target for the month and 6.5% higher than the production of July 2021. Cumulative production during April-July, 2022 was 88854.79 TMT, which is 6.75% and 12.05% higher than target for the period and production during corresponding period of last year respectively.
- Production of petroleum Products by Fractionators during July 2022 was 326.54 TMT, which is 2.12% lower than the target for the month and 9.38% lower than production of July 2021. Cumulative production during April-July, 2022 was 1240.29 TMT, which is 0.24% higher than target for the period but 10.25% lower than production during corresponding period of last year respectively.
Click here to see Annexure-III
************
YB/RKM
(Release ID: 1853815) Visitor Counter : 64


